What is Amazon Vendor RRA? #
Amazon Vendor Retail Reporting Analytics (RRA) provides vendors with detailed reporting on sales, inventory, traffic, and more.
The data is accessible via SP-API, and unlike manual downloads, an automated pipeline lets you:
- Pull data hourly (or on any schedule)
- Store it in a structured warehouse (BigQuery)
- Build real-time dashboards without manual exports
Use case: Track sales velocity, inventory health, and traffic patterns in near real-time for faster decision-making.
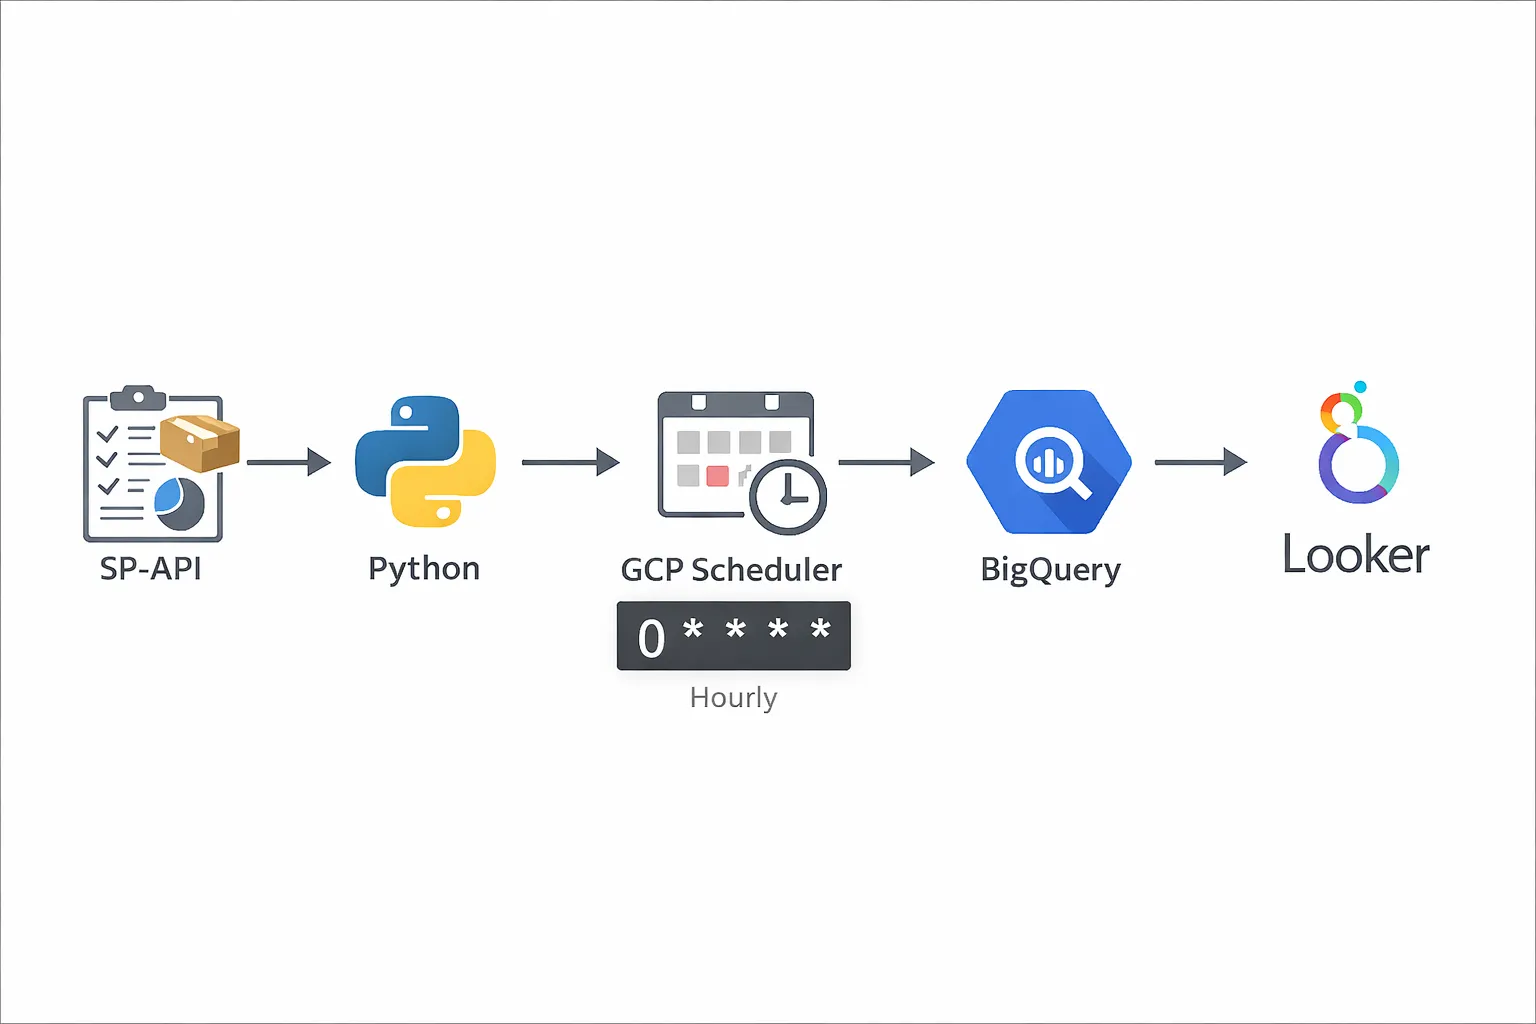
Architecture Overview #
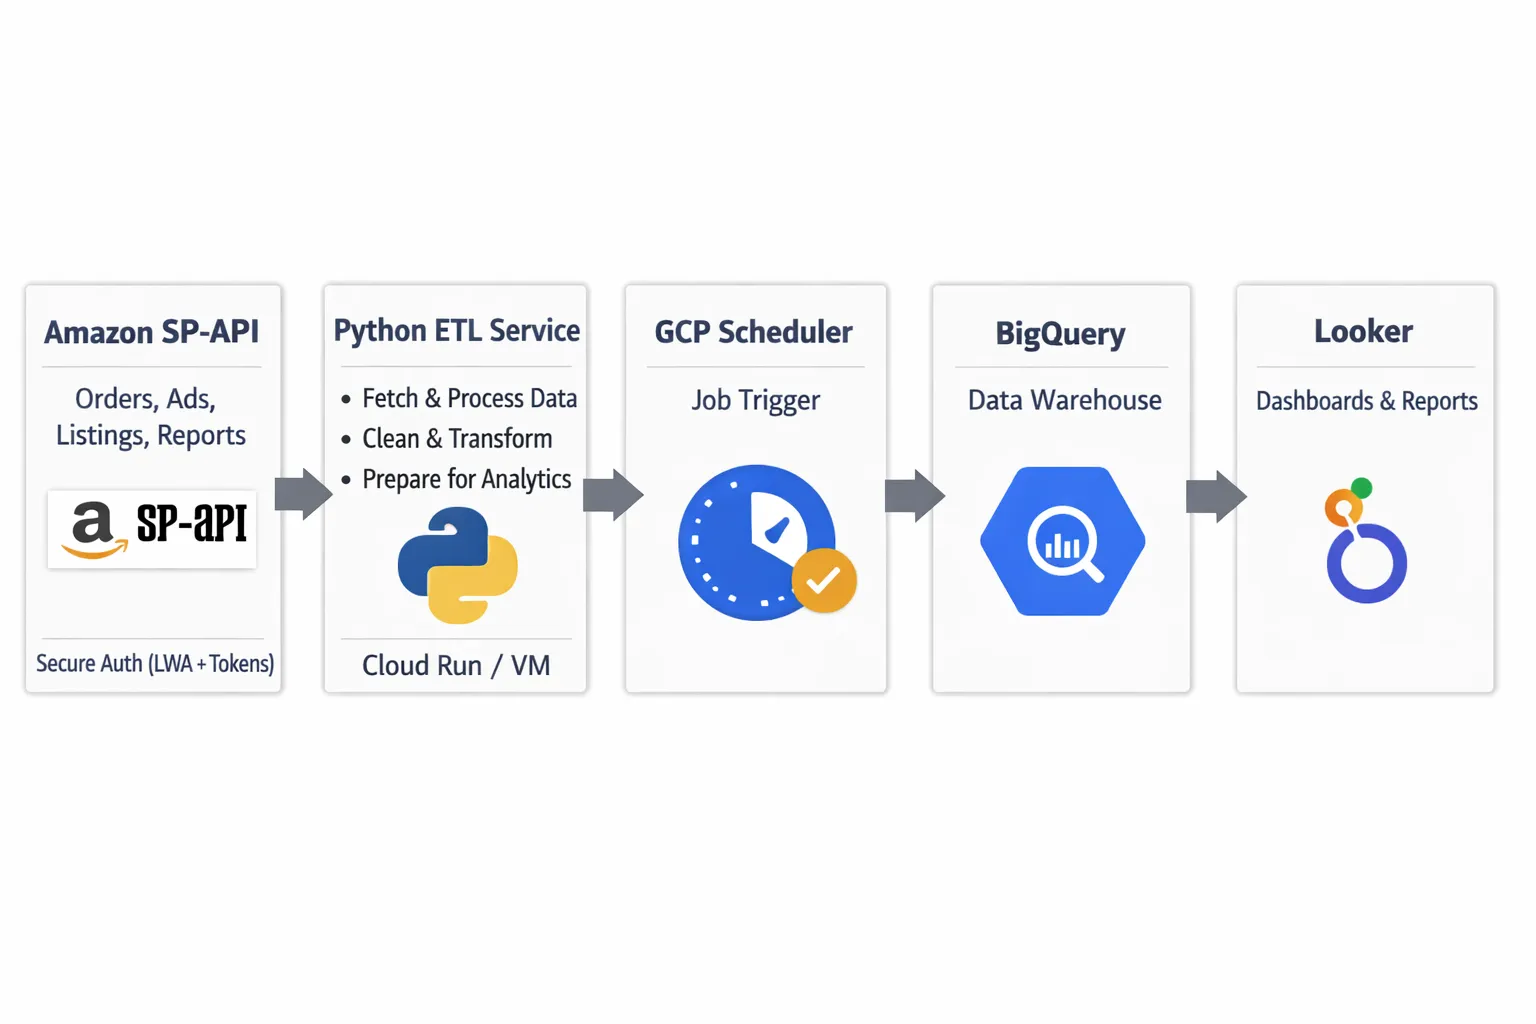
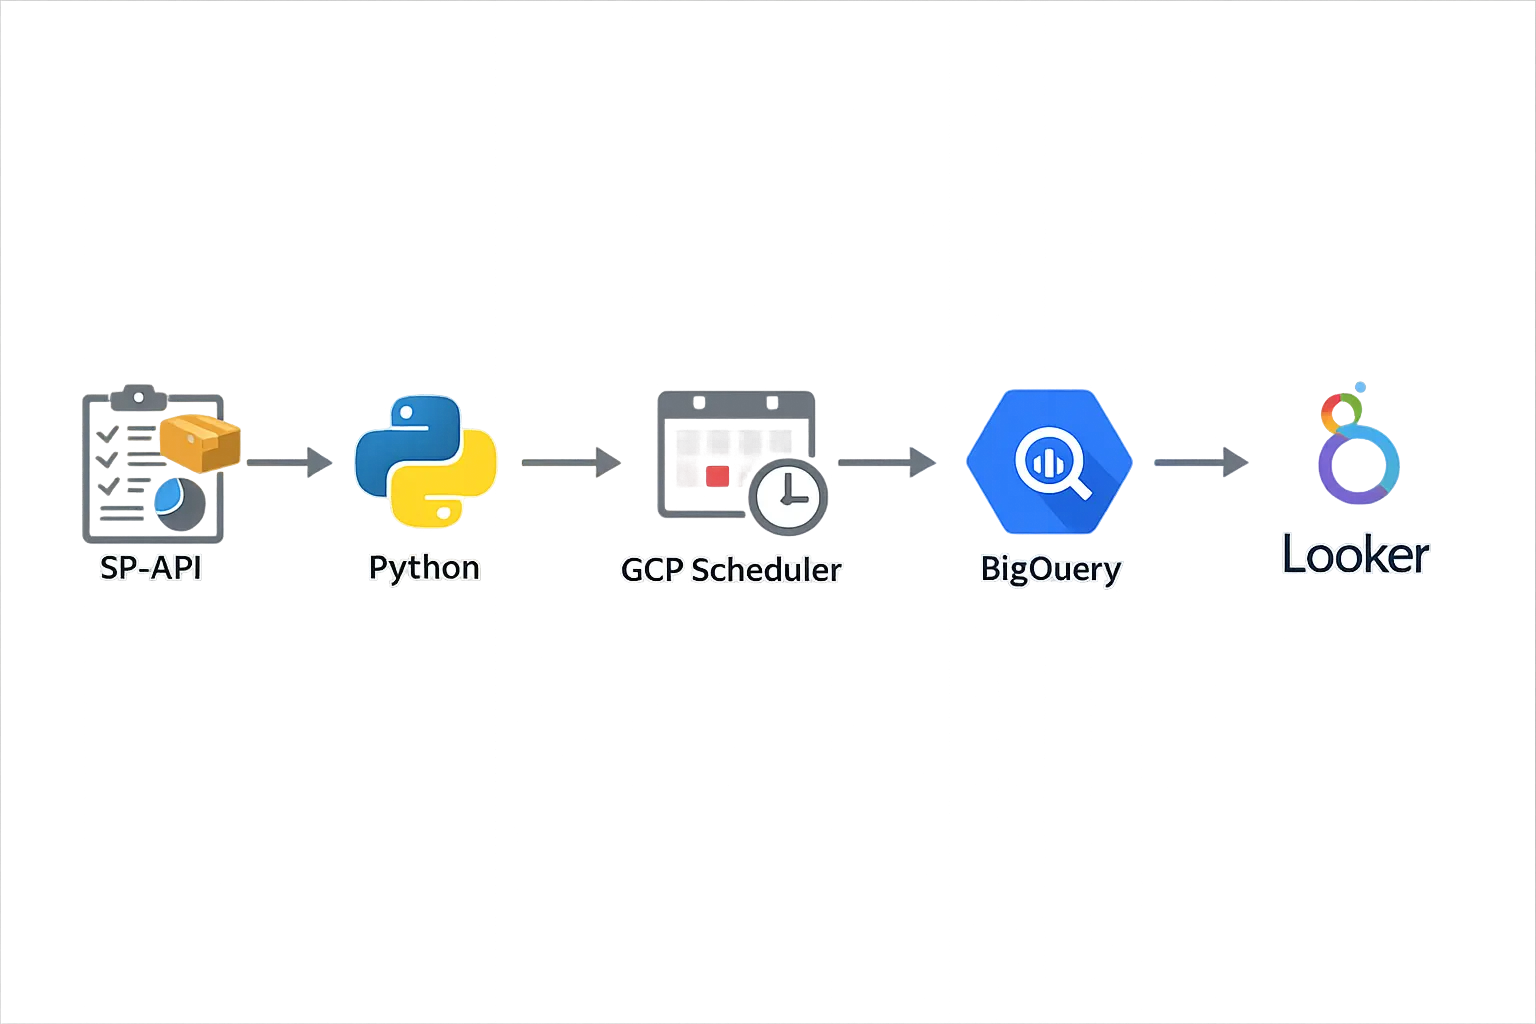
Here's the pipeline flow:
- SP-API → Pull RRA reports (Sales, Inventory, Traffic, etc.)
- Python script → Parse and transform the data
- GCP Cloud Scheduler → Trigger the script hourly
- BigQuery → Store structured data
- Looker Studio or custom dashboard → Visualize the data
Why GCP? Cloud Scheduler + Cloud Functions make scheduling simple. You can use AWS Lambda + EventBridge if you prefer AWS.
Step 1: Get SP-API Access for Vendor Reports #
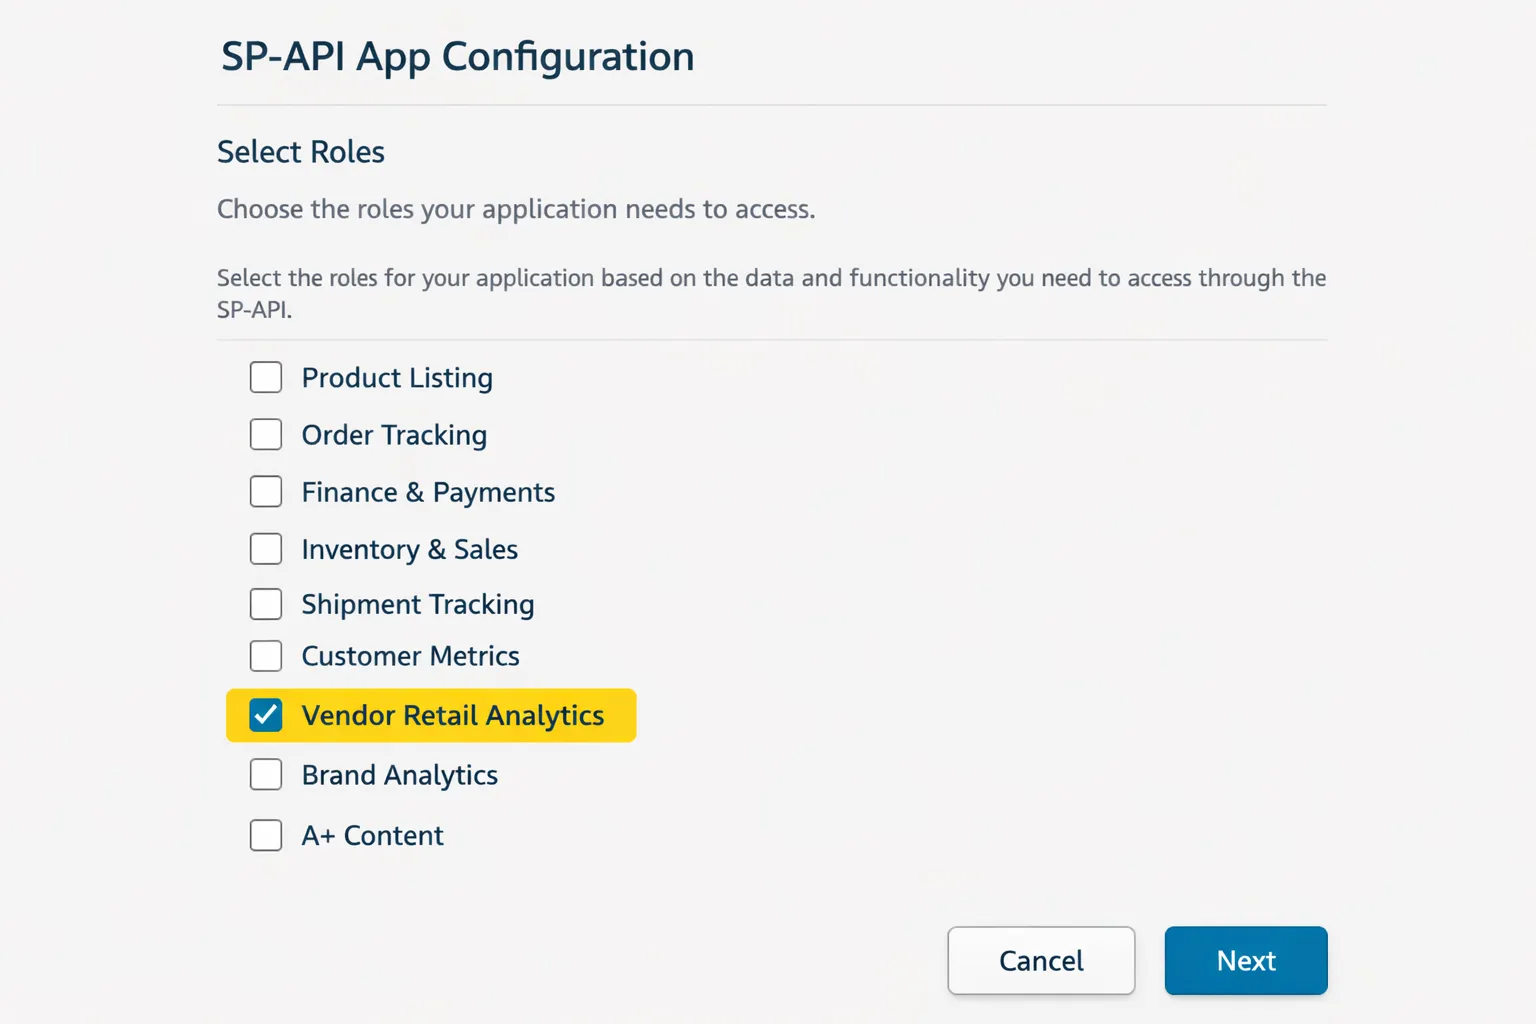
Before pulling RRA data, you need SP-API credentials with vendor reporting permissions.
Follow Amazon's Vendor Retail Analytics documentation to:
- Create an SP-API app in Vendor Central
- Request Retail Analytics role permissions
- Generate your refresh token
You'll need:
- Client ID
- Client Secret
- Refresh Token
Step 2: Write the Python Script to Pull RRA Data #
Your script will:
- Authenticate with SP-API using your credentials
- Request RRA reports (e.g., Sales, Inventory)
- Poll for report completion
- Download and parse the report
- Insert data into BigQuery
Sample Python structure:
import requests
import time
from google.cloud import bigquery

# 1. Get access token
def get_access_token(refresh_token, client_id, client_secret):
    # Exchange refresh token for access token
    pass

# 2. Request RRA report
def request_report(report_type, marketplace_id):
    # Call SP-API createReport endpoint
    pass

# 3. Poll report status
def poll_report_status(report_id):
    # Check if report is DONE
    pass

# 4. Download report
def download_report(report_document_id):
    # Download and decompress if needed
    pass

# 5. Insert into BigQuery
def insert_to_bigquery(data):
    client = bigquery.Client()
    table_id = "project.dataset.rra_sales"
    client.insert_rows_json(table_id, data)
    pass
Pro tip: Use watermarks (last processed timestamp) to avoid duplicate data. Store the watermark in a separate BigQuery table or GCS file.
Step 3: Schedule the Script on GCP #
You have two main options on GCP:
Option 1: Cloud Scheduler + Cloud Functions
- Deploy your script as a Cloud Function
- Use Cloud Scheduler to trigger it hourly
- Good for lightweight, event-driven jobs
Option 2: Cloud Scheduler + Cloud Run
- Package your script in a Docker container
- Deploy to Cloud Run
- Scheduler sends HTTP requests to trigger it
- Better for complex dependencies or longer-running jobs
Sample Cloud Scheduler cron:
# Run every hour at minute 5
0 * * * *
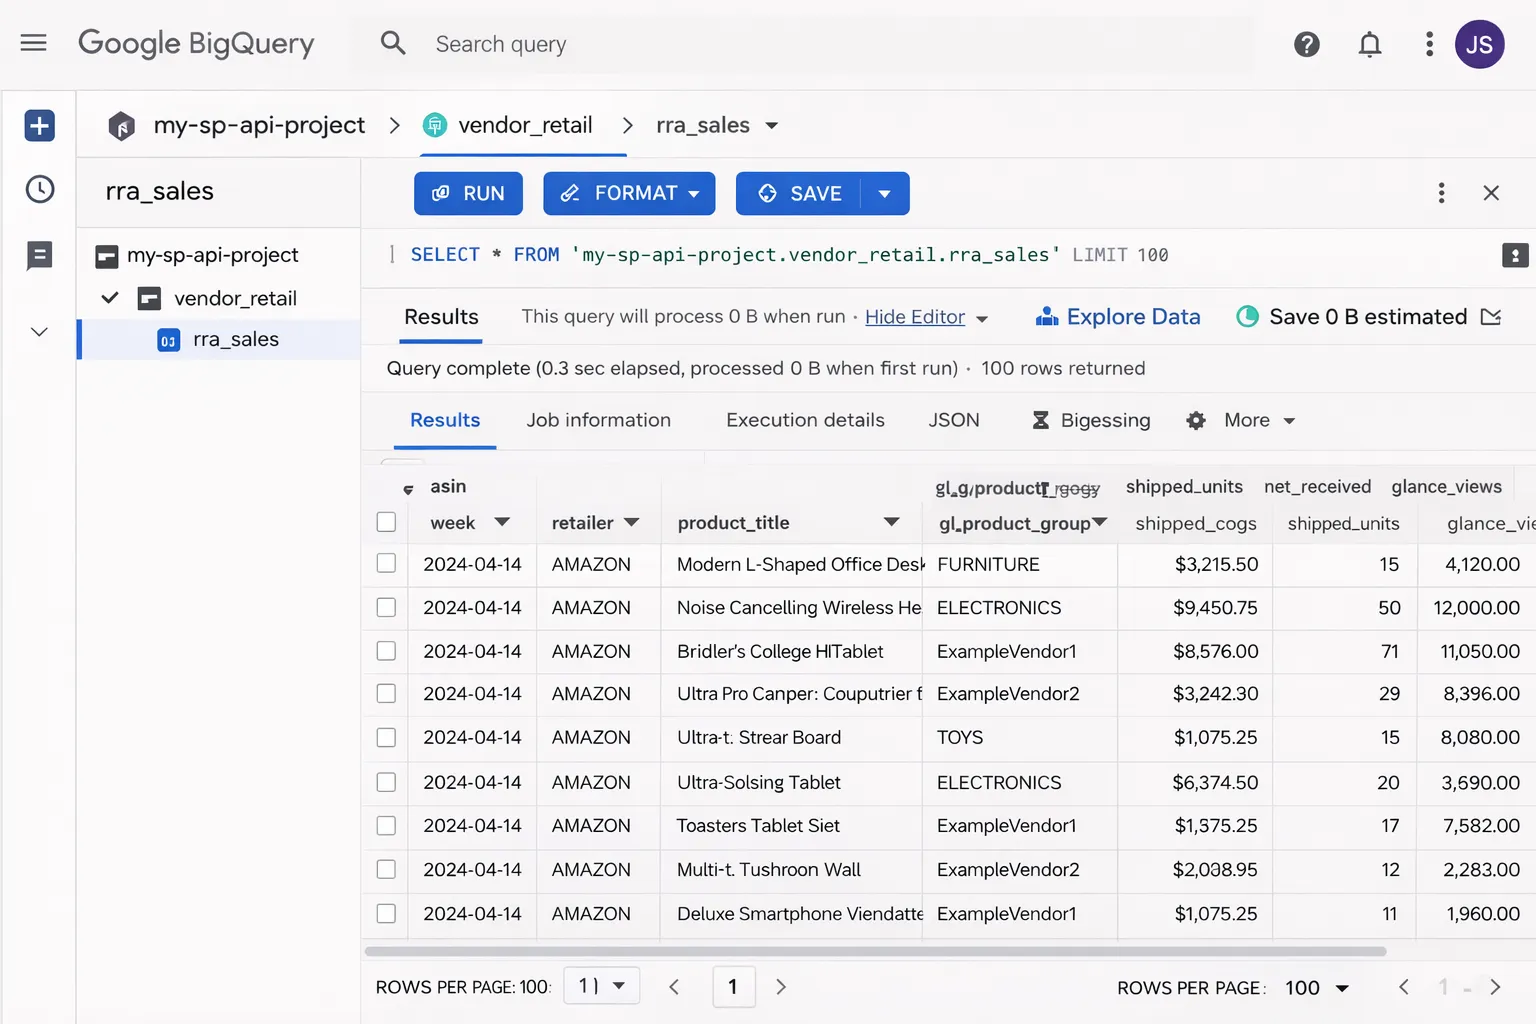
Step 4: Store Data in BigQuery #
Create a BigQuery dataset and tables for your RRA data:
-- Example: Sales table schema
CREATE TABLE `project.rra_data.sales` (
  report_date DATE,
  asin STRING,
  title STRING,
  ordered_units INT64,
  ordered_revenue FLOAT64,
  marketplace STRING,
  inserted_at TIMESTAMP DEFAULT CURRENT_TIMESTAMP()
)
PARTITION BY report_date;
Pro tip: Use partitioned tables (by date) for faster queries and lower costs on large datasets.
Your Python script inserts rows using the BigQuery client library:
from google.cloud import bigquery

client = bigquery.Client()
table_id = "project.rra_data.sales"

rows_to_insert = [
    {"report_date": "2026-01-20", "asin": "B08XYZ", "ordered_units": 42, ...}
]

errors = client.insert_rows_json(table_id, rows_to_insert)
if errors:
    print(f"Errors: {errors}")
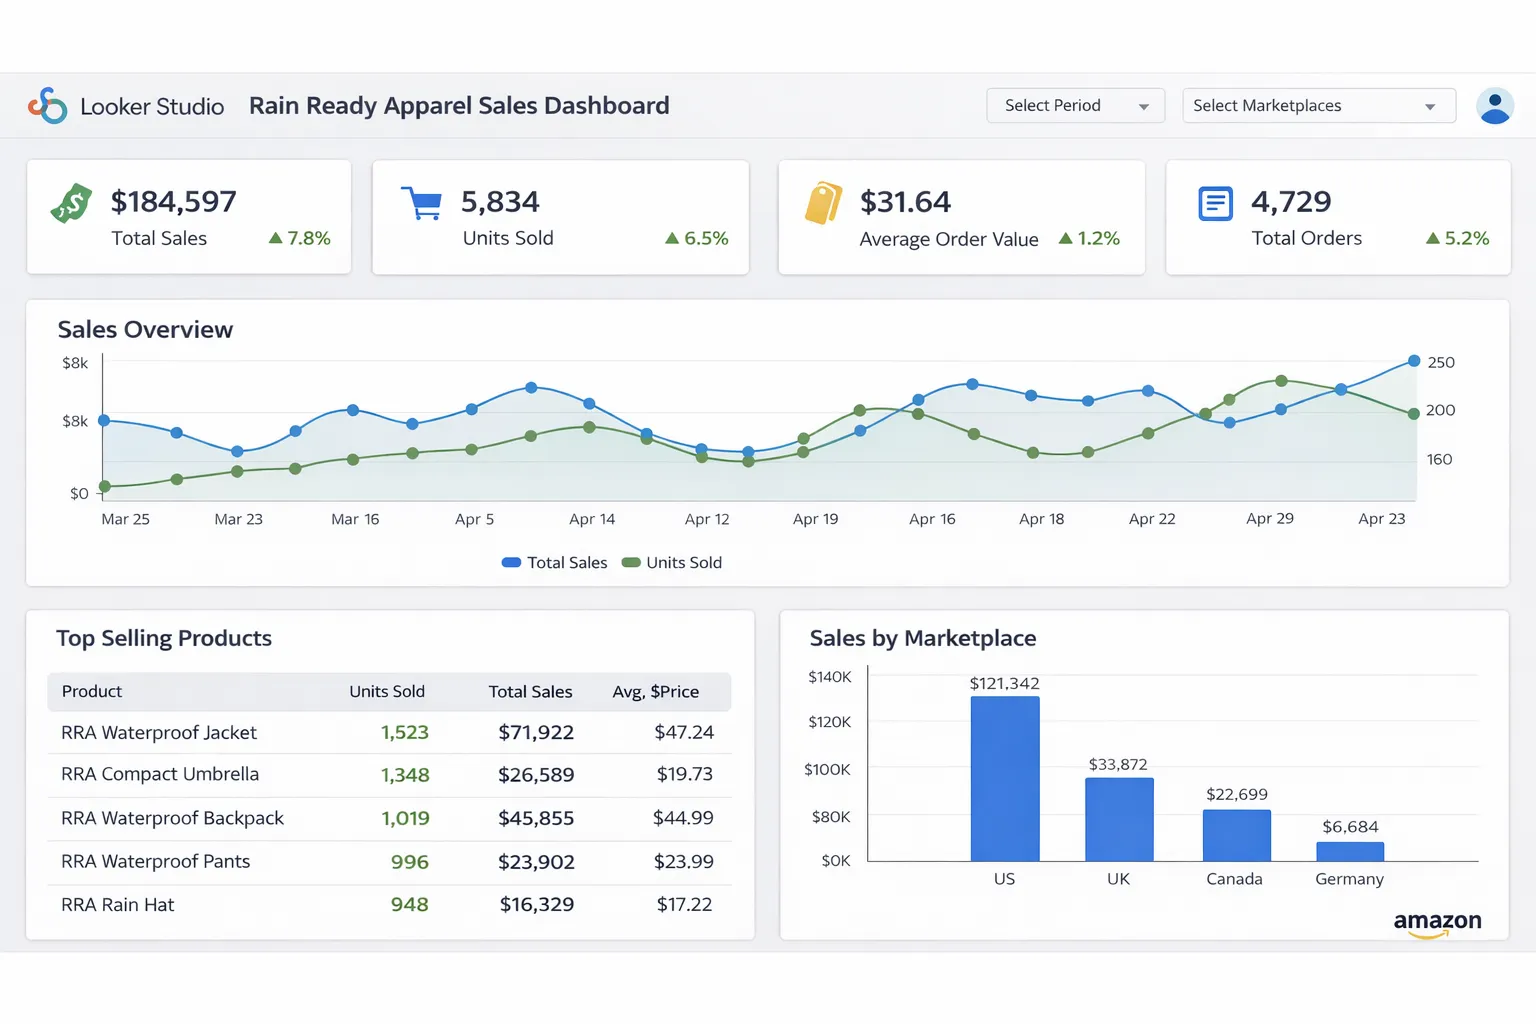
Step 5: Build Dashboards (Looker Studio or Custom) #
Option 1: Looker Studio (Fast & Simple)
- Connect Looker Studio to your BigQuery dataset
- Create charts: sales trends, top ASINs, inventory alerts
- Share with your team (read-only or editable)
Option 2: Custom Dashboard (More Control)
Build your own dashboard using:
- Django/Flask + Chart.js (Python backend)
- React + Recharts (JavaScript frontend)
- Streamlit or Dash (Python, rapid prototyping)
Query BigQuery from your app:
from google.cloud import bigquery

def get_sales_by_date():
    client = bigquery.Client()
    query = '''
        SELECT report_date, SUM(ordered_revenue) as revenue
        FROM `project.rra_data.sales`
        WHERE report_date >= DATE_SUB(CURRENT_DATE(), INTERVAL 30 DAY)
        GROUP BY report_date
        ORDER BY report_date
    '''
    results = client.query(query).to_dataframe()
    return results
Handling Errors and Retries #
Production pipelines need error handling:
1. Retry Logic
import time

def request_with_retry(url, max_retries=3):
    for attempt in range(max_retries):
        try:
            response = requests.get(url)
            response.raise_for_status()
            return response.json()
        except requests.exceptions.RequestException as e:
            if attempt == max_retries - 1:
                raise
            time.sleep(2 ** attempt)  # Exponential backoff
2. Alerting
Send alerts when jobs fail:
- Email via SendGrid or Gmail API
- Slack webhooks
- GCP Cloud Monitoring alerts
3. Dead Letter Queue (DLQ)
Store failed job metadata in a separate BigQuery table for investigation:
CREATE TABLE `project.rra_data.failed_jobs` (
  job_id STRING,
  error_message STRING,
  timestamp TIMESTAMP,
  retry_count INT64
);
Cost Optimization Tips #
- BigQuery: Use partitioned tables, avoid SELECT *, cache results
- GCP Functions: Set appropriate memory limits (don't over-provision)
- Cloud Scheduler: Free tier covers most use cases
- SP-API rate limits: Batch requests where possible to minimize calls
Typical monthly cost: $10-50 for small/medium vendors (assuming hourly pulls, 1-2 report types, basic dashboards).
What You Can Build Next #
Once your RRA pipeline is running, you can:
- Alerts: Notify when inventory drops below threshold
- Forecasting: Use historical data to predict demand
- Combined dashboards: Merge RRA with AMS (advertising) data for full-funnel insights
- Automated reporting: Schedule PDF reports via email
Need help implementing this?
Tell me your stack and what you want automated. I'll reply with a simple plan tailored to your needs.